|
A Guide to Implementing the Theory of
Constraints (TOC) |
|||||
|
Multi-Project Drums |
|
|
|
Critical Chain Project Management – A
Performance Engine For Projects Critical Chain
Project Management is the Theory of Constraints logistical application for
project operations. It is named after
the essential element; the longest chain of dependent resourced
tasks in the project. The aim of the
solution is to protect the duration of the project, and therefore completion
date, against the effects of individual task structural and resource
dependency, variation, and uncertainty.
The outcome is a robust and dependable approach that will allow us to
complete projects on-time, every time, and most importantly within at most
75% of the current duration for single projects and considerably less for
individual projects within multi-project environments. The shorter duration provides a sterling
opportunity in the marketplace to differentiate ourselves from our
competitors who deliver poorer outcomes, and late at that, via other project
management methods. It also offers the
opportunity to deliver more projects over all, in the same amount of time,
and at no increase in operating expense, thus significantly improving the
bottom line. Would that be
useful? Absolutely! I like to
think of Critical Chain Project Management as a performance engine for
projects. And, by “engine” I don’t
mean the thing under the hood of a bright red Ferrari, I was thinking more of
the 4000-6000 horsepower turbo-charged diesel engine that sits under the long
hood of each locomotive at the front of a North American transcontinental intermodal
freight train. The analogy isn’t so
far off. Such a freight train is long
and sinuous and interconnected, it is challenged by some fairly impressive
upgrades and is rewarded by coasting down some equally long downgrades, it
makes a number of “meets” or passes along the way, sometimes having the right
of way, sometimes having to wait for something else. But in the end the objective is to move the
freight quickly and effectively from one coast to the other and to arrive on
time. Critical Chain
Project Management is an amalgam of two parts; we need both parts to make a
really good show. If the chain of
critical tasks is the engine for projects, then buffer management is the
monitor. Buffer management is the
second part of this two part act. We
use buffer management to guide the way in which we fine tune the motor for
peak performance. In the older
notion of planning and control, or planning and execution, the first part;
the critical chain, is the planning stage of the approach. This is the overall agreement on the logic
and duration of the steps in the project.
The second part, buffer management, is the execution control system
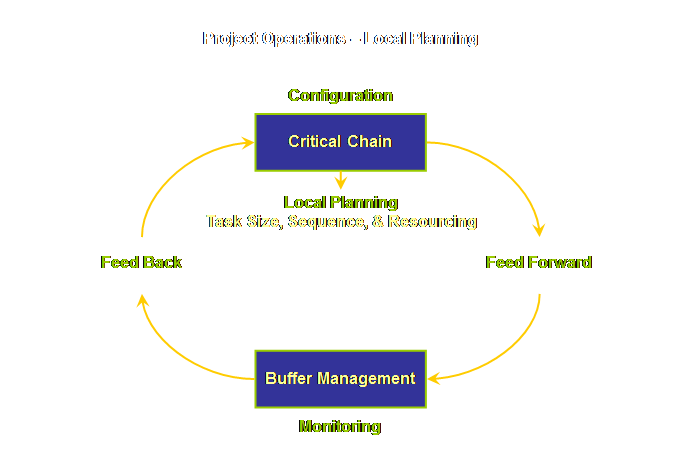
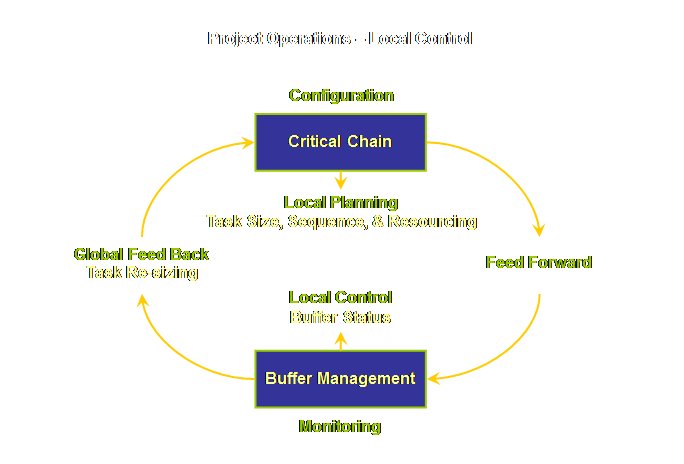
that allows us to keep a running check on the system. However, I want to reserve the words
“planning” and “control” for localized activities within individual
projects. For the moment I want to
step out a level and instead use the terms “configuration” and
“monitoring.” Configuration becomes the
generic rules for all Critical Chain Project Management, and monitoring via buffer
management becomes the feedback into these generic rules. Let’s draw this.
Let’s remind ourselves of our “plan of attack,” the
focusing process. On the measurements page we introduced the concept
of our “rules of engagement” which was to define; the system, the goal, the
necessary conditions, the fundamental measurements, and the role of the
constraints. On the paradigms page
this was extended to include the role of the non-constraints as well – an
important and too often overlooked aspect.
On the process of change page, we introduced the concept of our plan
of attack – Goldratt’s 5 focusing steps that allows us to define the role of
the constraints (and therefore also the role of the non-constraints). Once again, the 5 focusing steps for determining the
process of change are; (1) Identify the system’s constraints. (2) Decide how to Exploit the system’s constraints. (3) Subordinate everything else
to the above decisions. (4) Elevate the system’s constraints. (5) If in the previous steps a constraint has been broken Go back to step 1, but do not allow inertia to cause a
system constraint. In other words; Don’t Stop Improving. In all of the logistical applications of Theory of
Constraints we have used these same 5 focusing steps as a scheme or a road
map for explaining the detail of each application. There is no need to change our approach
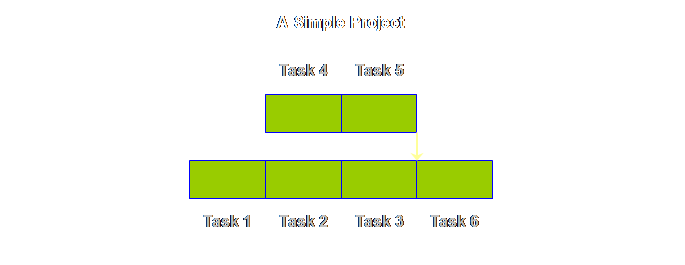
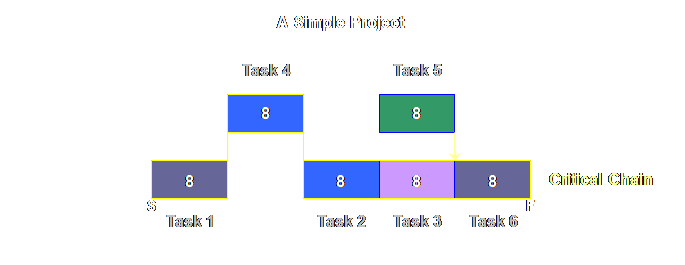
here, so let’s start at the start, with step 1; identify. Let’s have a look at our simple project – the one
that we used on the previous page in our prior discussion on buffers. However, let’s forget about buffers for a
moment, we will incorporate that newfound knowledge soon enough. Let’s concentrate first on the critical
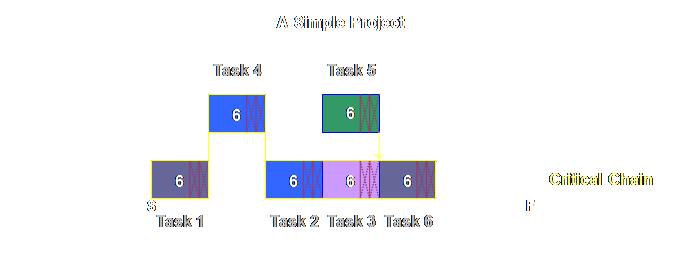
chain. Here is the project plan.
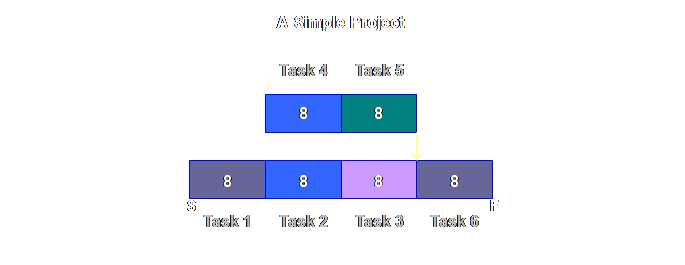
Let’s add some additional information, some task
durations, and some colors to represent differing resource allocations.
How does the earlier approach of Critical Path
Method deal with such conflicting resource allocations? There are two answers. The first is that it doesn’t deal with it
at all, it just ignores it completely.
This can be achieved by failing to resource the tasks or by resourcing
the tasks and then failing to “level” the project according to the
resourcing. But by far the better
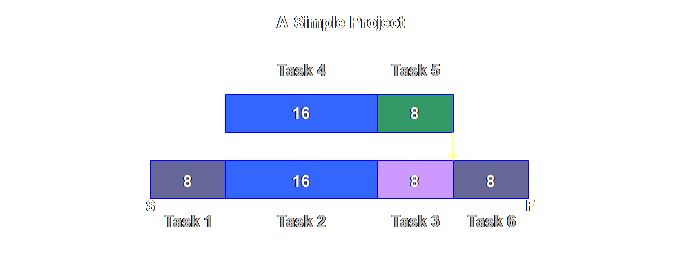
answer is to level the plan according to the resources. This is what we get.
Once we have leveled the plan according to the
resource availability we can determine the critical path in Critical Path
Method. Let’s have a look.
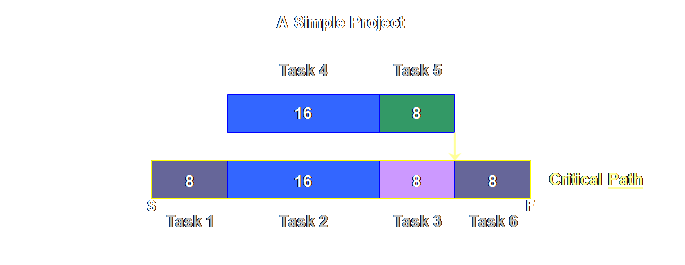
What then would be the critical chain? Let’s have a look.
In Critical Path Method the resource contention is
addressed by leveling. Here the
resource contention is addressed by moving task 4 back to an earlier
start. There is no reason why a project
manager using Critical Path Method would have not have used a similar
solution to address this particular resource contention. It is important to stress, however, the
principle of Critical Path Method, and that is that there is more than
sufficient resource capacity to undertake all the dependent tasks. Reality is often different. Reality requires resource leveling or
moving resource dependent tasks out of contention. In Critical Chain Project Management,
principle and reality are aligned.
Tasks are dependent and resources are always finite. We plan using that logic from the very
start. The strength of Critical Chain Project Management
comes into its own when we see how the buffering of the critical chain and
the buffering of the feeding chains protects the whole project. But we are getting ahead of ourselves. We have identified
the critical chain, the longest chain of dependent variables; both resource
and structural, and hence the shortest duration in which we can safely hope
to complete the project. Or is
it? Let’s see how we can exploit this
chain. We have identified the constraint, it is time. The only way that we can exploit this is to
achieve the same outcome in less time.
We can do this without working harder by addressing the mechanistic
and psychological factors that confound the safety time embedded within
individual tasks of the project.
Indeed, we have addressed all of these in some detail in the preceding
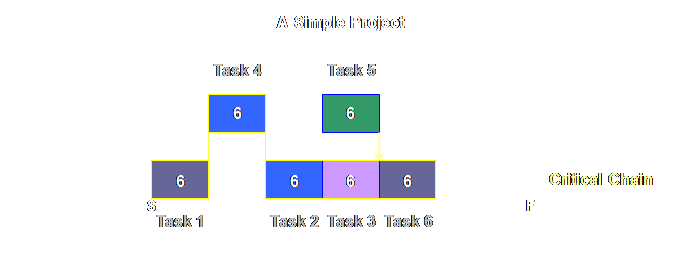
page on project buffers. The result,
the generic configuration for Critical Chain Project Management, is that we
can safely reduce the total project duration, the total touch time, to 75% of
the initial estimate. This is what we
will get.
It is the generic or global configuration that
determines the degree of exploitation of the Critical Chain. We don’t normally see it like this because
we arrive at this deduction from a different direction; identifying the
safety time, taking the safety time out, aggregating it, positioning it, and
then reducing the excess that arises as a consequence of aggregation and
global positioning. Because we have
already “been there done that” on the previous page, jumping to this step
shows clearly what constitutes exploitation.
It is the shortening of the critical chain that constitutes
exploitation. The project buffers are
not an exploitation step, they are a subordination step – they ensure that
our shortened project remains feasible.
If we were to leave the safety time localized and embedded within
individual tasks we would have no better chance of exploiting the critical
chain than we currently do. We will
come to subordination soon enough. At a local level, for each unique critical chain
project there is another level of exploitation, I want to call this local
planning. This is the determination of
each individual task in the project – or indeed whether something is treated
as one task, subdivided into two tasks, or amalgamated with another task to
create one larger task. It also
involves the determination of an appropriate initial task duration
estimate. This is an estimate that has
a reasonable chance of completion. It
is not a generous estimate that will ensure completion and it is not a tight
estimate that will ensure non-completion.
It is something that we should be reasonably comfortable with. We have previously addressed this as the
80% estimate. At a local level, for each unique critical chain
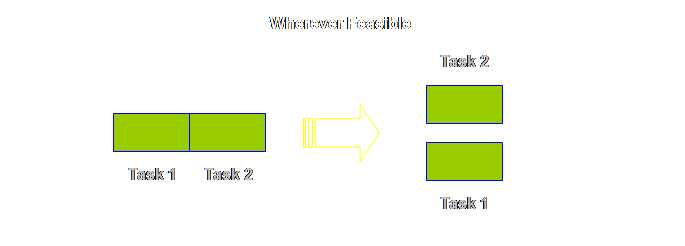
project we must also determine the correct sequence. This might appear trivial, but there are
very many projects where task B is done after task A because; “we have always
done it that way.” If we can, we
should take tasks that in the past were serial and make them parallel. This is what I mean;
Lastly, at a local level, for each unique critical chain
project, resource the tasks with appropriate people. A good place for less experienced people is
on the feeding chains, a good place for experienced people is on the critical
chain. Here is a summary diagram of the local planning
aspects.
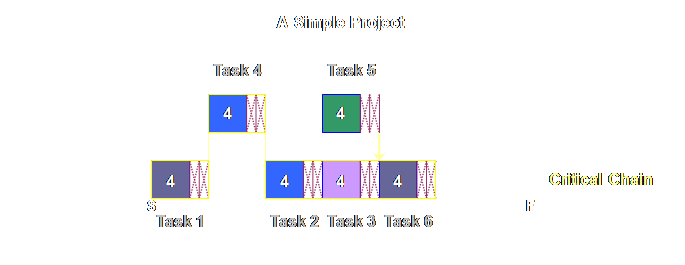
Let’s have a look then at subordination. Here is our Critical Chain once again, showing 75%
of the original task duration.
We then reduce our task touch time estimate
accordingly – by 2 units, to 4 units.
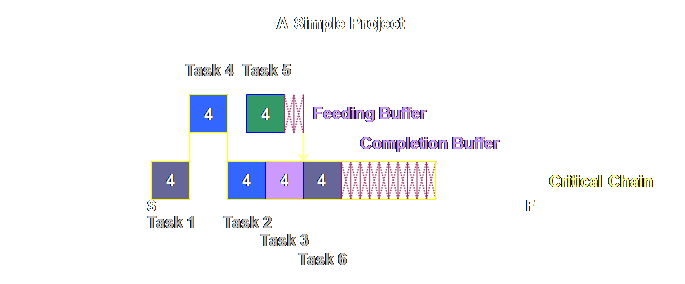
Let’s remind ourselves once again, Critical Chain
Project Management is a sequence, not a schedule. The task touch times are made short enough
that indeed some tasks can be completed within that time. Most, however, will probably need to use
some of the buffer time that is aggregated and available to the whole
project. The buffers subordinate the tasks
to the total project completion time and ensure that we are able to fully exploit the 25% reduction in completion time. We will take a journey through time and show how the
individual tasks and buffers operate and interact. But first, there are a few more
subordination issues to cover. The eagle-eyed amongst us, might have seen an
opportunity to further reduce the completion time and thus further exploit
the system. Because this option ends
up giving us two choices, it is worth following up as an alternative on a separate page. What else do we need to protect? Well if Critical Chain Project Management
is a sequence, not a schedule, then how do the various resources know when to
start their tasks? The answer is that
we must keep them “in the loop” as the project progresses. Although this has been termed a “resource
buffer” (1,2), it is really a “please let me know in advance” of the intended
task start date. The only scheduled
dates in this plan are the start and finish dates. A much more important subordination activity is the
removal of multi-tasking There seems little point in exploiting the
constraint, the amount of time taken to complete the project, if we then go
and extend the completion time by multi-tasking – the market won’t thank us
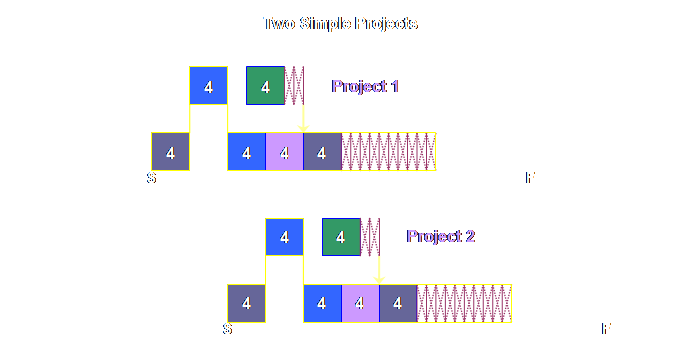
for doing that because it will not perceive a difference. Multi-tasking is the habit of having more than one
task from more than one project on the go at the same time. We “slice and dice”
between the competing priorities of the various projects. If nothing else, we extend individual task
time by the multiple of the number of concurrent tasks that we are working
on. If everyone in the system is doing
this – that is, it is happening to most tasks, it shouldn’t be surprising to
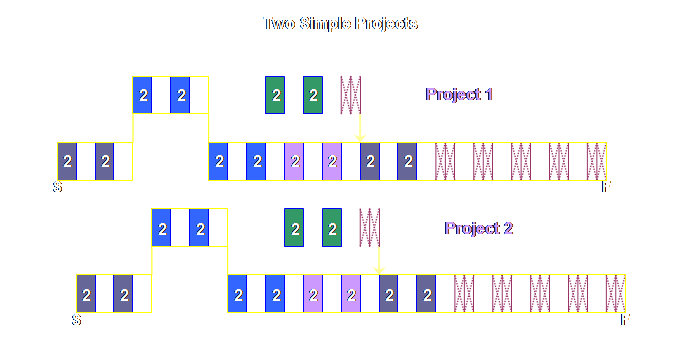
find whole projects taking longer as well as individual tasks. Here is a simple case, just two
projects. Let’s see what happens.
We all know the solution only too well too. We know that we have to stagger the release
of new projects into the system. We
know what it should look like in theory.
Let’s check.
In many manufacturing production operations,
production managers (or their sales people) often believe that putting new
work into the process stream earlier will ensure that it comes out earlier –
even when all past evidence is to the contrary – maybe there is some
satisfaction in saying “we started it the other day”. Oddly, in many project operations, project
managers (or their sales people) often believe that putting new work into the
project stream earlier will ensure that it comes out earlier – even when all
past evidence is to the contrary.
Again, maybe there is some satisfaction is saying “we started it the
other day.” So, you see, we are all
fairly much on even ground. When the current mode of project management is so
tightly aligned to Critical Path Method project planning and execution, it is
no wonder that multi-tasking is a fact of life, it is no wonder that projects
take longer and longer, and it is no wonder that there is real pressure to start the next project even sooner. What is needed is a better way to plan and
to execute and have some discipline to put it into effect. Critical Chain Project Management is
manifestly better but we have to supply the discipline. We will cover more of these aspects on the
implementation details page. Right now, we have worked our way through the identification, exploitation,
and subordination of a simple project, a
very simple project. Simple though it
may be, it however allows us to examine in relative safety, most of the
decisions that we need to make in order to bring project management into the
current century. Let’s now walk our
way through this simple project as it unfolds before us and see how the tasks
and the buffers interact. Let’s go. We have done our plan, and now we need to execute
it. Stuff will happen, it always does,
but we have hopefully protected our project through our buffering activities
so that we can complete the project on time and in less time than we
initially envisaged – 25% less time than the initial estimates would have us
believe. And although we have done this once before on the
previous page, let’s do it again, because we need the numbers generated to
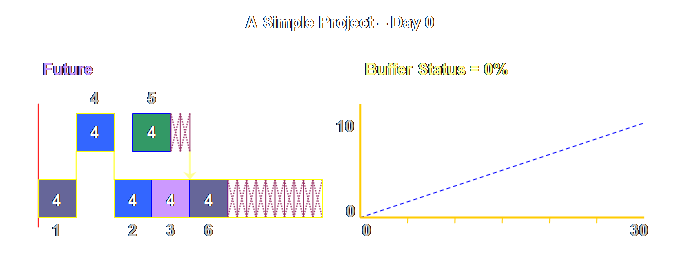
show us how buffer management and buffer status work. Here is our plan.
We have a buffer graph as well.
Let’s make our unit of time equal to days. On the graph, project duration, in days, is
along the horizontal axis and buffer penetration, in days, is along the
vertical axis. So we have a six week
project made up of 6 different tasks in one critical chain and one feeding
chain.
Buffer Penetration = Sum Task Estimates - Days
Elapsed - Active Task - Remaining Tasks Of these; the total task estimates are known prior to
deployment of the project, and so too are the durations of any remaining
tasks. The only variables are the days
elapsed (the duration since start and up to our review) and the task estimate
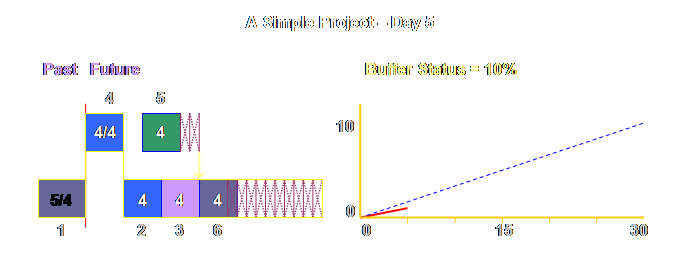
for any current task on the critical chain. For day 5 of our simple project we have; Buffer Penetration = 20 days - 5 days - 4 days -
12 days = (-) 1 day Really what we are saying is that given that we
estimate that we need 20 days; we must keep 4 plus 12 days in reserve for the
current and future tasks or 16 days in total.
That leaves 4 days for the completed tasks, but as we know we have
already taken 5 days, so we must take one additional day from the buffer. And that is exactly what we did. Buffer penetration doesn’t tell us much unless we
also know the extent of the buffer, in fact by knowing the extent of the
buffer we can determine the buffer penetration as a proportion rather than an
absolute measure. We use “buffer
status” as such a proportional measure.
Buffer status was defined for drum-buffer-rope make-to-order and
make-to-stock (3) and simplifies here as; Buffer Status = Buffer Penetration / Buffer
Duration In our example this is; Buffer Status = 1 day / 10 days = 10% Buffer status is synonymous with “buffer consumption.” Knowing the buffer status as a proportion rather
than as an absolute measure allows us to compare the progress of different
length feeding chains with the critical chain within a single project and to
also compare differing critical chains across different projects. Let’s press on, let’s look at how things have
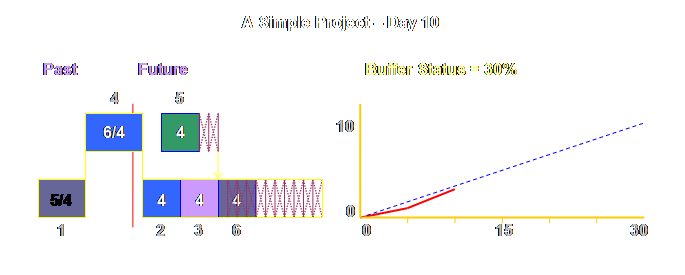
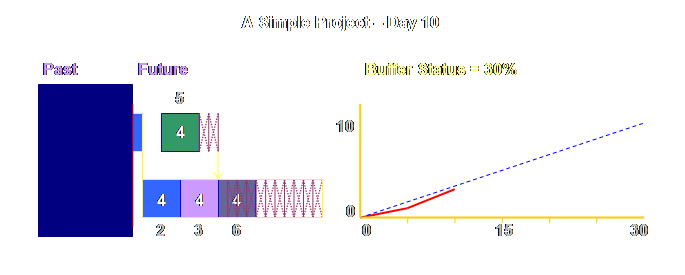
progressed by day 10.
Buffer
Penetration = Sum Task Estimates - Days Elapsed - Active Task - Remaining
Tasks Buffer
Penetration = 20 days - 10 days - 1 days - 12 days = (-) 3 days Buffer Status
= 3 days / 10 days = 30% Well hang-on a minute, let’s have a closer
look. Surely only 2 days of buffer
consumption have occurred already? By
the end of the 10th day, we could only feasibly have done two 4-day tasks, so
surely we could only have consumed 2 days from the buffer? In fact, history shows that task 1 took
5/4ths and task 4 took 5/4ths (up until the end of the 10th day). So this proves that two days of buffer were
consumed. We seem to have appropriated another day from the
buffer for the currently active task which at the end of day 10 still has 1
day to go. So why put that in the
buffer consumption now? Why cover the
base before we get there? We haven’t
consumed it yet. But by tomorrow, we
will have. Although, equally, we might
not; we might need more yet, or we might need less, it could be over by
lunchtime the next day. And, then, if
we are going to extrapolate for the active task, why not all the other future
tasks as well? It looks like a can of worms. Let’s try and straighten these worms out
for a minute. Logically we could
account for all future tasks – but how accurate would that be? And isn’t that what the buffer is there for
in any case? So, let’s leave the
future for the future. But at the present,
at the end of day 10, people are saying that 1 more day is still required to
complete task 4. Should we ignore
that? Surely the estimate of the
current task has some much greater validity, it is already active, we know
much better the contingent dependency that arises from the predecessor. The uncertainty must surely be diminished
as a consequence? These are the
reasons why we include the buffer consumption for the active task – even if
we haven’t consumed all of it just yet. Looking at it another way; if the completion time of
the task that we are working on is going to “blow out,” wouldn’t we want to
know that, wouldn’t we want to check that impact on the project as a whole,
wouldn’t we want to take remedial actions if they were required? OK, one more way to look at it. Forget about what you know of the detail of
the past. Let’s blank it out!
Scary not! But it certainly is
interesting. You see, we don’t need to
know what happened in the past. We
don’t need to know which tasks finished when; which tasks finished early or
which tasks finished late. We don’t
need to know which tasks took less than our estimate and which tasks took
longer. The critical chain is a chain
of dependencies. All the past actions
and non-actions feed through to the current task. If people had sat on their hands for the
first 10 days, we would know about it, because task 1 would still be active. All the hand-wringing in the world about what has
occurred and is done is of no immediate value – although we might like to
review it later so that we can learn from it – only decisions about future
tasks can have any effect. We can cut
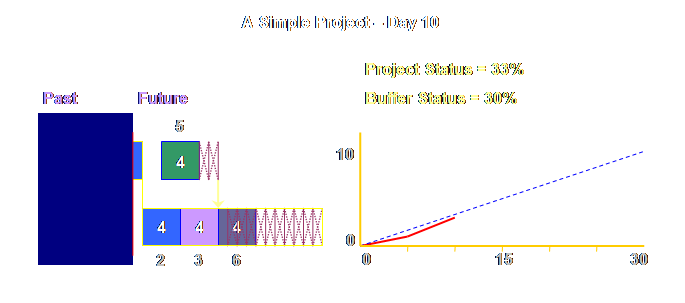
to the chase, and focus solely upon what lies ahead. Why we want to include the current task estimate
might make more sense if we consider the concept of “project status.” Let’s define project status as follows; Project Status = Elapsed Duration / Total
Project Duration In our example here, this is; Project Status = 10 days / 30 days = 33% If we have consumed 33% of our project, we ought to
have consumed 33% of our buffer, or maybe less. Let’s add this to the diagram.
So, when we include the active task in the buffer
penetration or buffer status we are saying that during the consumption of the
first 33% of the project we exposed ourselves to a 30% consumption of the
buffer. And the buffer is there to be
consumed, but not too quickly. Onwards.
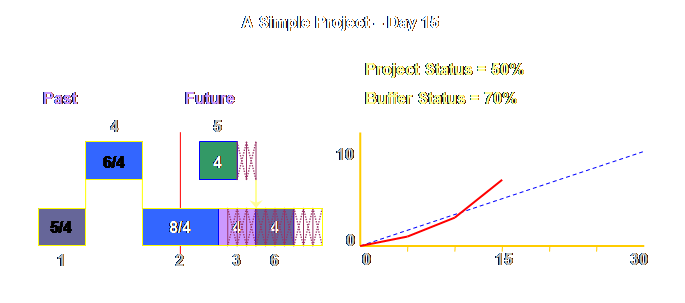
Let’s have a look at day 15.
We shouldn’t be alarmist, we shouldn’t go around
fire-fighting, but the individual buffer consumption rate of this task is
quite high. Maybe, just maybe, we
ought to take a closer look. And who
knows, this duration may be an unavoidable consequence; it could be
contingent dependency from predecessors, or current uncertainty in the active
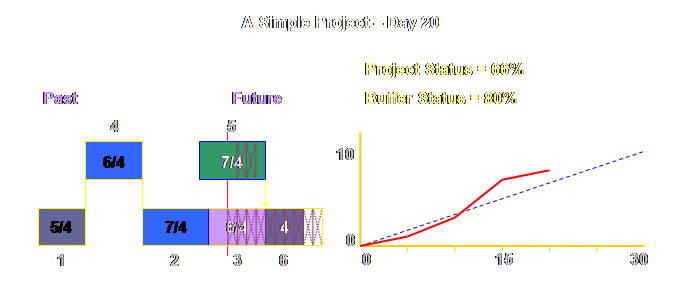
task, or everything else conspiring against “us.” Let’s see how things pan out by day 20.
The start date for the feeding task, task 5, has
been floating out as the project has progressed, finally it was triggered 3
days ago. Why not start it earlier if
we could have? There are a couple of
reasons for this. Let’s examine them. At a more general level there is a philosophy that
permeates Theory of Constraints that work should be held off the floor (and
out of the office) until the last reasonable moment. The reasons for this are clear; it is much
better not to confound the existing work with the work that is not yet
needed. Only quite recently has this
been relaxed somewhat in developments with simplified drum-buffer-rope
(S-DBR), but a pre-requisite for that is a market constraint, not an internal
constraint. Having said that, the
discipline must exist before it can be relaxed. Getting the discipline in the first place
is important. At a more specific level in project management we
have already noted the psychological challenges of procrastinating if a task
starts too early and filling time if a task has a long time to be
completed. And of course these are the
main reasons why we should start a buffered feeding chain task at the
appropriate time and no sooner. A feeding chain such as task 5 warrants its own
buffer management, but let’s omit that here, the principle is exactly the
same as for a critical chain, and our own simple critical chain is more than
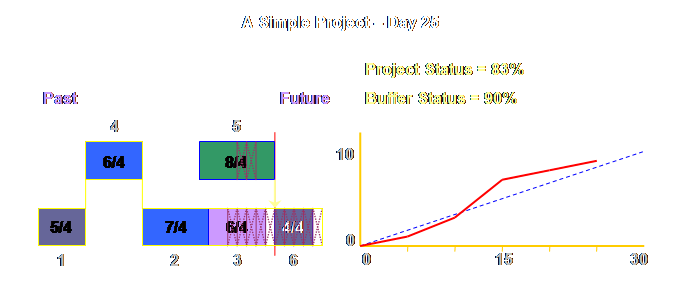
enough to work with at the moment. Let’s have a look at day 25.
This is an important development. Task 5 exceeded its own feeding buffer and
pushed through into the critical chain completion buffer. The consequence is that it has pushed the
starting date for task 6 out 1 day later.
We should always try to manage a feeding chain within its own buffer,
otherwise it will break through into the critical chain completion
buffer. Project status is currently
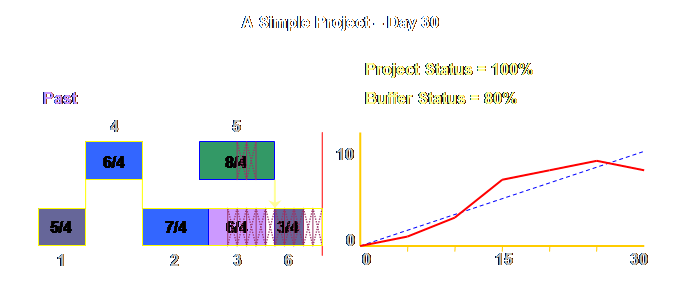
83% and buffer status exceeds this at 90% with only 5 days to go! Lets see how we finish up.
Now, that was a bit of a roller coaster ride. Comfort and common sense would suggest that
most of the time the buffer status line should stay on the underside of the
thin blue line. Here, in this case,
there were lots of new things to learn and we learnt them on the run and we
are better for doing so. There is an alternative buffer graph that is closer
to the 3-zone buffers of the other Theory of Constraints logistical solutions. It is in common use and is part of various
software packages. This variation is
discussed in more detail in the next page, the page on implementation
details. Remember that this project is now 25% shorter than
what we would normally have expected.
Don’t lose sight of what impact the 25% of “saved” time could have on
the bottom line when we sell it, especially if operating expense rather than
raw material is the main input into the project cost. And have no doubt that with a reduced lead
time we can sell that additional time, after all, time not the market, is our
constraint. One last thing; if we have paid all of our costs, so
to speak, we could sell the 25% available for a song, and would still be
making money. But would we want to do
that? I hope not. We would want our potential additional
customer to pay more, not less, for the faster more reliable on-time service
that we offer. Don’t forget that we
have the advantage, the objective is to find customers for whom this is also
a net benefit to their bottom line. If you wish to understand the leveraging effect of
an increase in productivity on profit, then please go back to the page called
Bottom Line and also check the page called Evaluating Change. It is explained there in much more detail. You will have noticed that we slipped an additional
diagram into our journey through time; a buffer graph. We needed to do this because the buffer
status at any moment in time allows us to make decisions about conflicting
priorities between tasks and resources within a single project (and between
tasks and resources in different projects).
This is our local control. Monitoring the consistent trend of the completion
buffer behavior over several projects provides a global feedback into how we
configure the critical chain in the first place, this ensures that we have a
process of on-going improvement. Let’s
draw this.
We only had one feeding chain in our simple project,
and it only had one task, this is hardly likely to be the case in reality. Reality is likely to have a number of
concurrent feeding chains – or at least it ought to have if we have reduced
the critical chain to its most essential serial tasks. As we saw in the example, a feeding chain
can burst through its own buffer and into the completion buffer. Which then is more important; project
feeding buffers or project completion buffers? Well the rules are as follows (4); § Within a single project, a feeding
buffer with a greater feeding buffer penetration and thus higher buffer
status warrants attention ahead of feeding buffers with lower feeding buffer
penetration and thus lower buffer status. § Within a single project, the completion
buffer with a greater completion buffer penetration and thus higher buffer
status warrants attention ahead of any feeding buffers with lower feeding
buffer penetration and thus lower buffer status. In a multi-project environment this extends to; § Between projects, projects with a
greater completion buffer penetration and thus higher buffer status warrant
attention ahead of projects with a lower completion buffer penetration and
thus lower buffer status. There should be proviso in this, which is addressed
in a little more detail in the next page on implementation details, and that
proviso is not to reward incorrect behavior by shifting resources to such an
area, nor punish correct behavior by shifting resources away from such an
area. In the interests of the greater
good (and on-time completion) this is so easy to do; managers must be seen to
be managing – right? Done without
regard to the above such management is counter-productive. There is a way out of this apparent
conflict. But that can wait until the
next page. The concept of Throughput dollar days (TDD), or
Throughput dollar days late as we have called it previously on the page for
drum-buffer-rope, has been ported directly to project management (5). But I am not sure that it provides us with
much useful information. However,
Ricketts offers a number of novel options for the performance measurement of projects
in service operations using Theory of Constraints accounting entities. He replaces Throughput Dollar Days with
Resource Dollar Days, and this is well worth following up (6). In the production operations solution;
drum-buffer-rope, and the distribution solution; replenishment, resizing of the
buffers was a global feedback mechanism.
If over time buffers proved to be too small or buffers proved to be
too large, then the buffers must be re-sized.
In Critical Chain Project Management the buffer size as a proportion
of the whole project must remain one third - a consistent and familiar number
to many of us. On this point Goldratt
seems emphatic; “The completion buffer should be 1/3rd of the total time”
(7). Clearly the absolute size of the
buffer changes as the absolute size of the various projects vary, but the
relative size always remains the same.
How then do we accommodate the case where our buffer rule seems to be
too generous or too tight? The answer is that we must change the task size
rather than the buffer size. It is
very likely that once trust is built up within an existing project
environment, the halving of the initial estimate to get a 50% task time will
produce projects that have considerable buffer to spare. This should be used to generate additional
throughput. If inertia causes the
initial estimates to remain at historic levels then a smaller task size can
be obtained by reducing the tasks to 44% rather than 50%. This is not a big difference, but it is
significant. The buffer then becomes
50% of 44% or 22% and the whole buffered Critical Chain is now 66% of the
original pre-critical chain estimate rather than 75%. In fact, if you don’t do this, then you
simply aren’t on a process of on-going improvement. This is how buffer management provides global
feedback into the configuration of the critical chain. Finally we arrive at the fourth step of our plan of
attack – the 5 focusing steps – which is to elevate the system’s
constraints. Generally this is viewed
to be an outside investment which raises the output of the constraint. This is easy to understand where the
constraint is something tangible, such as a machine or a specialist skill; we
have to go to the market and find more of whatever we are seeking. But what if the constraint is intangible? Wait a section and we will return to this
issue. More importantly, however, is the likelihood, as it
often it in production operations, that elevation isn’t something that needs
to be done early on. There will be a
very considerable amount of “hidden” capacity for quite a while and this
needs to be better utilized first. The last step in our plan of attack – the 5 focusing
steps – is to go back to the start of the process and start again if a
constraint has been broken. That is we
start to identify a new constraint; we don’t stop improving. The evidence in Critical Chain Project
Management is that rarely is there an internal constraint. If an internal constraint does emerge after
several iterations of our improvement process, then there is a method called
multi-project Critical Chain that will accommodate this. There is a short page on the mechanistic
details of this approach in the following pages. Most often, however, the cycle of
identify-exploit-subordinate yields better and better results and the market
remains the constraint – as it should.
It is an important step to make the realization that we are not
currently internally constrained at all – other than by our own thinking –
and move to exploit this ahead of others. Does anyone read Deming anymore, or has he been
“superseded” by the soft option of local improvement methods such as Six
Sigma. Six Sigma is a bit of a sop
really. No, in honesty, it is a huge
sop. It uses the statistical process
control mechanisms that Shewhart and Deming perfected between the 1920’s and
the Second World War but “cops out” at Deming’s later and important message
about global improvement. Deming said
“drive out fear” (8), he might equally well have said; drive in trust. We ought to learn something from that. The constraint is the critical chain, one
of the best investments we can make in reducing the critical chain is to
encourage trust. And it doesn’t cost a
thing. In production operations, there is abundant safety
time, but it is hidden, and ultimately the variability and serial dependency
in the tasks causes it to be wasted.
Implementing drum-buffer-rope is a small part of the solution. It is only with the development of trust
that productivity really soars. In project operations, there is abundant safety
time, but it is well hidden, and ultimately the variable and serial
dependency in the tasks causes it to be wasted. Implementing Critical Chain Project
Management is a small part of the solution.
It is only with the development of trust that productivity really
soars. So, I am suggesting here, that in order to elevate
the constraint in project operations, the real investment isn’t financial, it
is something else; it is the investment in developing trust within the
organization. It doesn’t cost anything
and it goes an awful long way. You know this already. The mechanistic causes and the
psychological causes confound one another.
If we can tease them apart far enough to understand the effects, then we
can move forward. Go to it. Critical Chain Project Management is a unique method
that allows operations with large task touch times, with competing structural
and resource dependencies, and large variability and uncertainty to be
completed on-time in consistently less time.
It does this by identifying the longest chain of dependent tasks and
shorter chains of parallel feeding tasks and then protecting the whole system
by aggregating and then relocating the safety embedded in each task at the end
of the respective chains. The total
safety can then be reduced while fully averaging out the natural over-runs
and under-runs that occur in estimating task durations. In addition, buffer management provides a robust
form of day-to-day feedback on individual project progress, as well as longer
term feedback into the configuration of the solution. Let’s now look at some of the implementation
details. (1) Newbold, R. C.,
(1998) Project management in the fast lane: applying the Theory of
Constraints. St. Lucie Press, pp 61,
64, 267. (2) Leach,
L.P., (2000) Critical chain project management. Artech House Inc., pp 112-113. (3)
Schragenheim, E., (2002) Make-to-stock under drum-buffer-rope and buffer
management methodology. APICS
International Conference Proceedings, Session I-09, 5 pp. (4) Goldratt, E. M., (1998) Project Management the
TOC Way. Avraham Y. Goldratt Institute
Limited, pg 89. (5) Newbold, R. C., (1998) Project
management in the fast lane: applying the Theory of Constraints. St. Lucie Press, pp 203-204. (6) Ricketts, J. A., (2008) Reaching the goal: how managers improve a
services business using Goldratt’s Theory of Constraints. IBM Press, pp 181-182. (7) Goldratt, E. M., (2002) TOC on project management and engineering:
a self learning program. Goldratt’s
Marketing Group (video-based tutorial) section 16. (8) Deming, W.
E., (1982) Out of the crisis.
Massachusetts Institute of Technology, Centre for Advanced Education,
507 pp. This Webpage Copyright © 2008 - 2009 by Dr K. J.
Youngman |